Sample Size for Population Survey
Menu location: Analysis_Sample Size_Population Survey.
This function gives you the minimum number of subjects that you require for a survey of a population for the proportion of individuals in that population displaying a particular factor, with a specified tolerance (Colton, 1974; Feinstein, 2002).
Information required
- cc: confidence level (1-alpha, where alpha is the two sided probability of detecting a false effect: double alpha if you need a one sided estimate).
- N: population size.
- p%: estimate of rate (as a percentage) at which characteristic occurs in the population.
- d%: absolute deviation from p% that you would tolerate (i.e. p% give or take d%).
Technical validation
The estimated sample size n is calculated, using simple Gaussian theory, as:
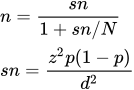
- where p is p%/100, d is d%/100, and z is a quantile from the standard normal distribution for a two tailed probability of 1-cc. n is rounded up to the closest integer.
Example
Suppose you plan a survey of smoking among the adults of a town, about 20,000 people. From surveys elsewhere you expect about 25% of them to smoke, and you want the percentage in your sample to be within 3% of the percentage in the town, either way, with 95% confidence. The figures are invented for this illustration.
To run this in StatsDirect select Population Survey from the Sample Size section of the Analysis menu. Enter 20000 as the population size, 25 as the rate, 3 as the acceptable deviation and 95% as the confidence level.
For this example:
Sample size for a population survey
Population estimate = 20000
Population rate = 25%
Maximum deviation = ±3%
Confidence level = 95
Estimated minimum sample size = 770
A simple random sample of 770 adults would be enough. Without the finite population correction, as for a population of unlimited size, 801 would be needed: the correction matters little unless the sample is a substantial fraction of the population.

 R code
This R code reproduces the example above. It needs no packages and was checked with R 4.6.1. Paste it into R, or save it as a script and run it.
# Sample size for a population survey: the StatsDirect help example (an invented
# survey of smoking among the 20,000 adults of a town, expected 25% give or take 3%,
# with 95% confidence) in R
N <- 20000                                # size of the population to be sampled
p <- 25 / 100                             # expected proportion with the characteristic
d <- 3 / 100                              # acceptable absolute deviation, plus or minus
conf <- 0.95                              # confidence level

# Base R has no function for this survey sample size, so the topic's formula is used:
# the size for an unlimited population from the normal approximation to the binomial,
# then the finite population correction, then rounding up to a whole number of subjects.
z <- qnorm(1 - (1 - conf) / 2)            # two sided: 1.959964 for 95% confidence
sn <- z^2 * p * (1 - p) / d^2             # for an unlimited population
n <- sn / (1 + sn / N)                    # with the finite population correction
# StatsDirect adds one to the whole part of n instead, so a rate of exactly 0% or 100%
# (n = 0) gives 1 there and 0 here; they differ only when n is a whole number
cat("Population estimate =", format(N, scientific = FALSE), "\n")
cat("Population rate =", paste0(100 * p, "%"), "\n")
cat("Maximum deviation = +/-", paste0(100 * d, "%"), "\n")
cat("Confidence level =", 100 * conf, "\n")
cat("Estimated minimum sample size =", ceiling(n), "\n")

# The same survey of a population of unlimited size, for comparison
cat("Sample size for an unlimited population =", ceiling(sn), "\n")