Kendall's Rank Correlation
Menu location: Analysis_Nonparametric_Kendall Rank Correlation.
Kendall's rank correlation provides a distribution free test of independence and a measure of the strength of dependence between two variables.
Spearman's rank correlation is satisfactory for testing a null hypothesis of independence between two variables but it is difficult to interpret when the null hypothesis is rejected. Kendall's rank correlation improves upon this by reflecting the strength of the dependence between the variables being compared.
Consider two samples, x and y, each of size n. The total number of possible pairings of x with y observations is n(n-1)/2. Now consider ordering the pairs by the x values and then by the y values. If x3 > y3 when ordered on both x and y then the third pair is concordant, otherwise the third pair is discordant. S is the difference between the number of concordant (ordered in the same way, nc) and discordant (ordered differently, nd) pairs.
Tau (τ) is related to S by:
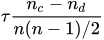
If there are tied (same value) observations then τb is used:

- where ti is the number of observations tied at a particular rank of x and ui is the number tied at a rank of y.
In the presence of ties the statistic τb is given as a variant of τ adjusted for ties (Kendall, 1970). When there are no ties τb = τ. An approximate confidence interval is given for τb or τ. Please note that the confidence interval does not correspond exactly to the P values of the tests because slightly different assumptions are made (Samara and Randles, 1988).
The gamma coefficient is given as a measure of association that is highly resistant to tied data (Goodman and Kruskal, 1963):
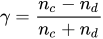
Tests for Kendall's test statistic being zero are calculated in exact form when there are no tied data, and in approximate form through a normalised statistic with and without a continuity correction (Kendall's score reduced by 1).
Technical Validation
An asymptotically distribution-free confidence interval is constructed for τb or τ using the variant of the method of Samara and Randles (1988) described by Hollander and Wolfe (1999).
In the presence of ties, the normalised statistic is calculated using the extended variance formula given by Hollander and Wolfe (1999). In the absence of ties, the probability of null S (and thus τ) is evaluated exactly from the frequency distribution of S (built by recurrence) when n ≤ 1000 and by an Edgeworth series expansion when n > 1000 (Best and Gipps, 1974). In the presence of ties you are guided to make inferences from the normal approximation (Kendall and Gibbons, 1990; Conover, 1999; Hollander and Wolfe, 1999). Note that StatsDirect uses more accurate methods for calculating the P values associated with τ than does most other statistical software, therefore, there may be differences in results.
Example
From Armitage and Berry (1994, p. 466).
Test workbook (Nonparametric worksheet: Career, Psychology).
The following data represent a tutor's ranking of ten clinical psychology students as to their suitability for their career and their knowledge of psychology:
| Career | Psychology |
| 4 | 5 |
| 10 | 8 |
| 3 | 6 |
| 1 | 2 |
| 9 | 10 |
| 2 | 3 |
| 6 | 9 |
| 7 | 4 |
| 8 | 7 |
| 5 | 1 |
To analyse these data in StatsDirect you must first enter them into two columns in the workbook. Alternatively, open the test workbook using the file open function of the file menu. Then select Kendall Rank Correlation from the Nonparametric section of the analysis menu. Select the columns marked "Career" and "Psychology" when prompted for data.
For this example:
Kendall's rank correlation
Career vs. Psychology
Observations per sample = 10
Concordant pairs = 34
Discordant pairs = 11
Tied pairs = 0
Kendall's score = 23 (standard error = 11.18034)
Gamma = 0.511111
Kendall's tau = 0.511111
Approximate 95% CI = 0.135203 to 0.887019
Approximate tests
Sample size too small for reliable inference from z, use exact test
z = 2.057183
Upper side P = 0.0198 (H1: concordance)
Lower side P = 0.9802 (H1: discordance)
Two sided P = 0.0397 (H1: dependence)
z (continuity corrected) = 1.96774
Upper side P = 0.0245 (H1: concordance)
Lower side P = 0.9755 (H1: discordance)
Two sided P = 0.0491 (H1: dependence)
Exact test
Upper side P = 0.0233 (H1: concordance)
Lower side P = 0.9857 (H1: discordance)
Two sided P = 0.0466 (H1: dependence)
From these results we reject the null hypothesis of mutual independence between the career suitability and psychology knowledge rankings for the students. With a two sided test we are considering the possibility of concordance or discordance (akin to positive or negative correlation). A one sided test would have been restricted to either discordance or concordance, this would be an unusual assumption. In our example we can conclude that there is a statistically significant lack of independence between career suitability and psychology knowledge rankings of the students by the tutor. The tutor tended to rank students with apparently greater knowledge as more suitable to their career than those with apparently less knowledge and vice versa.

 R code
This R code reproduces the example above. It needs no packages and was checked with R 4.6.1. Paste it into R, or save it as a script and run it.
# Kendall's rank correlation: the StatsDirect help example (Armitage and Berry
# 1994, p. 466) in R
career     <- c(4, 10, 3, 1, 9, 2, 6, 7, 8, 5)
psychology <- c(5, 8, 6, 2, 10, 3, 9, 4, 7, 1)
n <- length(career)

# R's standard test. Its T is the number of concordant pairs (34). Without ties
# and with fewer than 50 pairs its P is exact, as is StatsDirect's.
# Use alternative = "greater" for the upper side P and "less" for the lower.
print(cor.test(career, psychology, method = "kendall"))

# The rest of this code is for data without ties. With ties R's P is no longer
# exact, tau b replaces tau, and the variance of the score needs an adjustment.
stopifnot(!anyDuplicated(career), !anyDuplicated(psychology))
upper <- cor.test(career, psychology, method = "kendall",
                  alternative = "greater")$p.value
lower <- cor.test(career, psychology, method = "kendall",
                  alternative = "less")$p.value
cat("Exact test:  Upper side P =", round(upper, 4), "  Lower side P =",
    round(lower, 4), "  Two sided P =", round(min(1, 2 * min(upper, lower)), 4),
    "\n")

# Concordant and discordant pairs, Kendall's score and tau
q <- sign(outer(career, career, "-")) * sign(outer(psychology, psychology, "-"))
concordant <- sum(q[upper.tri(q)] > 0)
discordant <- sum(q[upper.tri(q)] < 0)
score <- concordant - discordant
se <- sqrt(n * (n - 1) * (2 * n + 5) / 18)     # standard error of the score
tau <- score / (n * (n - 1) / 2)
tied <- n * (n - 1) / 2 - concordant - discordant
cat("Concordant pairs =", concordant, "  Discordant pairs =", discordant,
    "  Tied pairs =", tied, "\n")
cat(sprintf("Kendall's score = %d   (standard error = %.5f)\n", score, se))
cat(sprintf("Gamma = %.6f\n", score / (concordant + discordant)))

# Approximate 95% confidence interval for tau: the method of Samara and Randles
# (1988) as given by Hollander and Wolfe (1999)
ci <- rowSums(q)                                # each observation's own score
v <- 2 / (n * (n - 1)) *
  (2 * (n - 2) / (n * (n - 1)^2) * sum((ci - mean(ci))^2) + 1 - tau^2)
limits <- tau + c(-1, 1) * qnorm(0.975) * sqrt(v)
cat(sprintf("Kendall's tau = %.6f   Approximate 95%% CI = %.6f to %.6f\n",
            tau, limits[1], limits[2]))

# Approximate tests from the normal distribution, without and with a continuity
# correction (StatsDirect advises the exact test for a sample as small as this)
for (cc in c(0, 1)) {
  z <- (score - cc * sign(score)) / se
  cat(sprintf("z = %.6f   Upper side P = %.4f   Lower side P = %.4f   %s%.4f\n",
              z, 1 - pnorm(z), pnorm(z), "Two sided P = ", 2 * pnorm(-abs(z))))
}