Cuzick's Test for Trend
Menu location: Analysis_Nonparametric_Cuzick Trend Test.
This function provides a Wilcoxon-type test for trend across a group of three or more independent random samples.
Assumptions:
-
data must be at least ordinal
-
groups must be selected in a meaningful order i.e. ordered
If you do not choose to enter your own group scores then scores are allocated uniformly (1 ... n) in order of selection of the n groups.
The test statistic is calculated as follows:
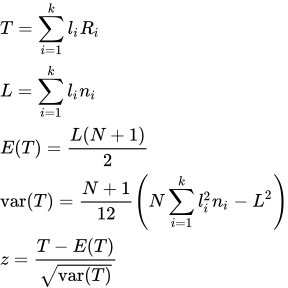
- where Ri is the sum of the pooled ranks for the ith group, li is the sum of scores for the ith group, ni is the sample size for the ith group and N is the total number of observations. For the null hypothesis of no trend across the groups T will have mean E(T), variance var(T) and the null hypothesis is tested using the normalised test statistic z.
Technical Validation
A logistic distribution is assumed for errors. Probabilities for z are derived from the standard normal distribution. Please note that this test is more powerful than the application of the Wilcoxon rank-sum / Mann-Whitney test between more than two groups of data (Cuzick, 1985).
Example
From Cuzick (1985).
Test workbook (Nonparametric worksheet: CMT 64, CMT 167, CMT 170, CMT 175, CMT 181).
Mice were inoculated with cell lines, CMT 64 to 181, which had been selected for their increasing metastatic potential. The number of lung metastases found in each mouse after inoculation are quoted below:
| CMT 64 | CMT 167 | CMT 170 | CMT 175 | CMT 181 |
| 0 | 0 | 2 | 0 | 2 |
| 0 | 0 | 3 | 3 | 4 |
| 1 | 5 | 6 | 5 | 6 |
| 1 | 7 | 9 | 6 | 6 |
| 2 | 8 | 10 | 10 | 6 |
| 2 | 11 | 11 | 19 | 7 |
| 4 | 13 | 11 | 56 | 18 |
| 9 | 23 | 12 | 100 | 39 |
| 25 | 21 | 132 | 60 | |
| 97 |
To analyse these data in StatsDirect you must first enter them in five workbook columns appropriately labelled. Alternatively, open the test workbook using the file open function of the file menu. Then select Cuzick's Trend Test from the Nonparametric section of the analysis menu. Select the columns marked "CMT 64", "CMT 167", "CMT 170", "CMT 175" and "CMT 181" when prompted for data. Click on "No" when you are prompted about group scores, this does not apply to most analyses provided you select the variables in the order you are studying them. With automatic group scoring you must be careful to select the variables in the order across which you want to look for trend.
For this example:
Cuzick's trend test
Groups = 5
Observations = 45
Order: CMT 64 (1), CMT 167 (2), CMT 170 (3), CMT 175 (4), CMT 181 (5)
Ez = 3.022222
Var(z) = 1.93284
T = 3386.5
ET = 3128
Var(T) = 15003.666667
z = 2.110386
One sided P = 0.0174
Two sided P = 0.0348
Corrected for ties:
Var(T) = 14943.375253
z = 2.114639
One sided P = 0.0172
Two sided P = 0.0345
With these data we are interested in a trend in one direction only, therefore, we can use a one sided test for trend. We have shown a statistically significant trend for increasing number of metastases across these malignant cell lines in this order.

 R code
This R code reproduces the example above. It needs no packages and was checked with R 4.6.1. Paste it into R, or save it as a script and run it.
# Cuzick's trend test: the StatsDirect help example (Cuzick 1985) in R
mets <- list("CMT 64"  = c(0, 0, 1, 1, 2, 2, 4, 9),
             "CMT 167" = c(0, 0, 5, 7, 8, 11, 13, 23, 25, 97),
             "CMT 170" = c(2, 3, 6, 9, 10, 11, 11, 12, 21),
             "CMT 175" = c(0, 3, 5, 6, 10, 19, 56, 100, 132),
             "CMT 181" = c(2, 4, 6, 6, 6, 7, 18, 39, 60))
score <- 1:5                              # the order of the groups: 1, 2, 3 ...
mets <- lapply(mets, function(v) v[!is.na(v)])    # missing values are left out

# R has no standard function for this test. It is a Wilcoxon-type test for trend
# across ordered groups: T is the sum over all observations of group score
# times rank, compared with its expectation under no trend.
y <- unlist(mets)
z <- rep(score, lengths(mets))            # each observation's group score
N <- length(y)
r <- rank(y)                              # tied values share a mid-rank
Tstat <- sum(z * r)
Ez <- mean(z)
ET <- (N + 1) / 2 * sum(z)
varz <- mean(z^2) - Ez^2
varT <- N^2 * (N + 1) / 12 * varz
ties <- table(y)
varTties <- varT * (1 - sum(ties^3 - ties) / (N^3 - N))
cat("Groups =", length(mets), "  Observations =", N, "\n")
cat(sprintf("Ez = %.6f   Var(z) = %.5f\n", Ez, varz))
cat(sprintf("T = %g   ET = %g   Var(T) = %.6f\n", Tstat, ET, varT))
for (v in c(varT, varTties)) {
  zstat <- (Tstat - ET) / sqrt(v)
  cat(sprintf("%sz = %.6f   One sided P = %.4f   Two sided P = %.4f\n",
              if (v == varT) "" else sprintf("Corrected for ties: VarT = %.6f   ", v),
              zstat, pnorm(-abs(zstat)), 2 * pnorm(-abs(zstat))))
}