Menu location: Graphics_Survival.
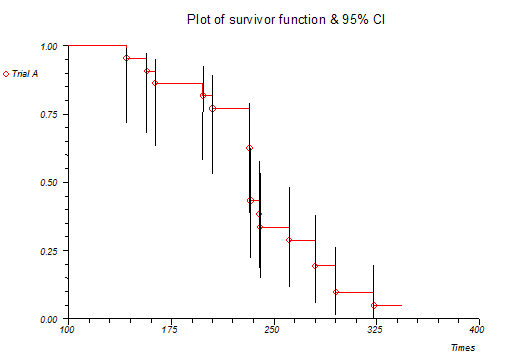
This provides a step plot for displaying survival curves. It is intended for use with variables for Time on the x (horizontal) axis and S (the Kaplan-Meier product limit estimate of survival / survivor function) on the Y (vertical) axis. You can display multiple series, each with a different marker style. Confidence intervals for S can be displayed.
Note that censored times are marked with a small vertical tick on the survival curve.
This is a good accompaniment to a presentation of survival analysis that compares survival (or time to event) data in different groups. See Kaplan-Meier for more information on generating S.

Copyright © 2000-2019 StatsDirect Limited, all rights reserved. Download a free trial here.