Screening Test Errors
Menu location: Analysis_Clinical Epidemiology_Screening Test Errors.
This function gives the probability of false positive and false negative results with a test of given sensitivity and specificity and a given prevalence of disease (Fleiss, 1981).
When considering a diagnostic test for screening populations it is important to consider the number of false negative and false positive results you will have to deal with. The quality of a diagnostic test is often expressed in terms of sensitivity and specificity. Sensitivity is the ability of the test to pick up what you are looking for and specificity is the ability of the test to reject what you are not looking for.
| DISEASE | |||
| Present | Absent | ||
| TEST: | +: | a (true +ve) | b (false +ve) |
| -: | c (false -ve) | d (true -ve) | |
Sensitivity = a/(a+c)
Specificity = d/(b+d)
We can apply Bayes' theorem if we know the approximate likelihood that a subject has the disease before they come for screening, this is given by the prevalence of the disease. Here the false positive rate is the proportion of positive results that are false, P(no disease | positive test), which is 1 - positive predictive value; the false negative rate is the proportion of negative results that are false, P(disease | negative test), which is 1 - negative predictive value. Note that many texts use these two names for 1 - specificity and 1 - sensitivity, which are different quantities: the proportion of disease-free people who test positive and the proportion of diseased people who test negative. For low prevalence diseases the false negative rate will be low and the false positive rate will be high. For high prevalence diseases the false negative rate will be high and the false positive rate will be lower. People are often surprised by the high numbers of projected false positives, you need a highly specific test to keep this number low. The false positive rate of a screening test can be reduced by repeating the test. In some cases a test is performed three times and the patient is declared positive if at least two out of the three component tests were positive.
Technical Validation
Results are calculated as:
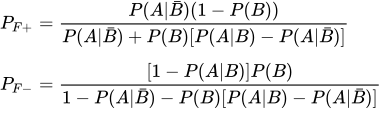
- where PF+ is the false positive rate P(B bar|A) (= 1 - positive predictive value), PF- is the false negative rate P(B|A bar) (= 1 - negative predictive value), P(A|B) is the probability of A given B, A is a positive test result, A bar is a negative test result, B is disease present and B bar is disease absent.
Example
In a hypothetical example 4000 patients were tested with a screening test for a disease. Of these 4000 patients 2000 were known to have the disease and 2000 were known to be free of the disease:
| DISEASE | |||
| Present | Absent | ||
| TEST: | +: | 1902 (true +ve) | 22 (false +ve) |
| -: | 98 (false -ve) | 1978 (true -ve) | |
To analyse these data in StatsDirect select Screening Test Errors from the Clinical Epidemiology section of the Analysis menu. Enter sensitivity as 0.951 (1902/(1902+98)) and 1-specificity as 0.011 (22/(1978+22)). Enter the prevalence as 1 in 100 by entering n as 100.
For this example:
For an overall case rate of 100 per ten thousand population tested:
Test SENSITIVITY = 95.1%
Probability of a FALSE POSITIVE result = 0.533824
Test SPECIFICITY = 98.9%
Probability of a FALSE NEGATIVE result = 0.0005
Here we see that more than half of the patients who give a positive test will not have the disease (about 1% of all patients tested will give a false positive result). This is clearly not acceptable for a full screening method but could be used as pre-screening before further tests if there was no better initial test available.

 R code
This R code reproduces the example above. It needs no packages and was checked with R 4.6.1. Paste it into R, or save it as a script and run it.
# Screening test errors (Bayes' theorem): the StatsDirect help example (a hypothetical
# screening test tried on 4000 patients, 2000 with the disease and 2000 without) in R
tp <- 1902   # a: test positive, disease present
fp <- 22     # b: test positive, disease absent
fn <- 98     # c: test negative, disease present
tn <- 1978   # d: test negative, disease absent
counts <- matrix(c(tp, fp, fn, tn), 2, byrow = TRUE,
                 dimnames = list(Test = c("Positive", "Negative"),
                                 Disease = c("Present", "Absent")))
print(addmargins(counts))

# The test's sensitivity and specificity come from the trial; the prevalence of the
# disease in the population to be screened is entered as 1 in n
sensitivity <- tp / (tp + fn)                    # P(positive test | disease)
specificity <- tn / (fp + tn)                    # P(negative test | no disease)
n <- 100
prevalence <- 1 / n                              # P(disease) before the test
six <- function(x) formatC(x, digits = 6, format = "f", drop0trailing = TRUE)
cat("For an overall case rate of", six(prevalence * 10000),
    "per ten thousand population tested:\n")

# Base R has no function for this, so Bayes' theorem is applied directly. The false
# positive rate is the probability that a positive result is wrong, P(no disease |
# positive test), which is 1 - positive predictive value; the false negative rate is
# P(disease | negative test), which is 1 - negative predictive value
p_positive <- sensitivity * prevalence + (1 - specificity) * (1 - prevalence)
false_positive <- (1 - specificity) * (1 - prevalence) / p_positive
false_negative <- (1 - sensitivity) * prevalence / (1 - p_positive)
cat("Test SENSITIVITY = ", six(100 * sensitivity), "%\n", sep = "")
cat("Probability of a FALSE POSITIVE result =", six(false_positive), "\n")
cat("Test SPECIFICITY = ", six(100 * specificity), "%\n", sep = "")
cat("Probability of a FALSE NEGATIVE result =", six(false_negative), "\n")

# The same answers from the expected counts in 10000 people screened: 100 have the
# disease, of whom 95.1 test positive, and 9900 do not, of whom 108.9 test positive
screened <- 10000
diseased <- screened * prevalence
expected <- matrix(c(diseased * sensitivity, (screened - diseased) * (1 - specificity),
                     diseased * (1 - sensitivity), (screened - diseased) * specificity),
                   2, byrow = TRUE, dimnames = dimnames(counts))
print(addmargins(expected))
cat("False positives among the positive results =",
    six(expected["Positive", "Absent"] / sum(expected["Positive", ])), "\n")
cat("False negatives among the negative results =",
    six(expected["Negative", "Present"] / sum(expected["Negative", ])), "\n")