2 by K Chi-square Test
Menu location: Analysis_Chi-square_2 by k.
Several proportions can be compared using a 2 by k chi-square test. For example, a random sample of people can be subdivided into k age groups and counts made of those individuals with and those without a particular attribute. For this sample, a 2 by k chi-square test could be used to test whether or not age has a statistically significant effect on the attribute studied. This is a test of the independence of the row and column variables, it is equivalent to the chi-square independence tests for 2 by 2 and r by c chi-square tables.
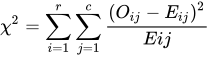
- where, for r rows and c columns of n observations, O is an observed frequency and E is an estimated expected frequency. The expected frequency for any cell is estimated as the row total times the column total then divided by the grand total (n).
Assumptions of the tests of independence:
- the sample is random
- each observation may be classified into one cell (in the table) only
Note that an exact test of independence is provided in the r by c table analysis function; you should use this instead of the chi-square statistic when you have small numbers (say expected frequency less than 5) in any of the table cells.
If there is a meaningful order to your k groups (e.g. sequential age bands) then the chi-square test for trend provides a more powerful test than the unordered independence test above. StatsDirect automatically performs a test for linear trend across the k groups. You can enter your own scores for the trend test. For example, if a variable was categorised as mild, moderate or severe pain then scores 1, 2 and 3 are likely to be reasonable, so leave StatsDirect to assign scores. If, instead, the categories were mild, moderate and worst ever pain then you might enter a linear score system as 1, 2 and 5 respectively (Armitage and Berry, 1994; Altman, 1991).
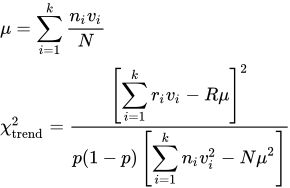
- where each of k groups of observations are denoted as ri successes out of ni total with score vi assigned. R is the sum of all ri, N is the sum of all ni and p = R/N.
If all of the scores are the same then there is no trend to test, and if there are no successes or no failures then the chi-square statistics cannot be calculated: the results say so.
You can ask for a simulated exact P value for the test for trend. Tables are drawn at random from those that have the row and column totals of your table, and the P value is the proportion of them that have a chi-square for trend equal to or greater than that of your table; it is given with an exact (Clopper-Pearson) confidence interval for that proportion. Frequencies that are not whole numbers are rounded to the nearest whole number for the simulation, and the results say when this has been done. The simulation is made for tables of up to 5,000,000 observations.
Should you wish to investigate your 2 by k table further then the r by c chi-square test provides a more detailed analysis. Please note that the linear trend analysis may differ slightly between the 2 by k and r by c chi-square tests, this is because the r by c linear trend analysis is not calculated as above but instead considers trend in both dimensions of the table (closely related to Pearson's correlation).
Example
From Armitage and Berry (1994).
The following data describe numbers of children with different sized palatine tonsils and their carrier status for Strep. pyogenes.
| Tonsils | |||
| not enlarged | Enlarged | Enlarged greatly | |
| Carriers: | 19 | 29 | 24 |
| Non-carriers: | 497 | 560 | 269 |
To analyse these data in StatsDirect you must select Trend Scores 1 to K from the 2 by K sub-menu of the chi-square section of the analysis menu. Enter the numbers of carriers in the success column and the numbers of non-carriers in the failure column, one row for each tonsil size in the order above, and do not ask for a simulated exact P.
For this example:
| Successes | Failures | Total | Per cent | |
| Observed: | 19 | 497 | 516 | 3.68 |
| Expected: | 26.575107 | 489.424893 | ||
| Observed: | 29 | 560 | 589 | 4.92 |
| Expected: | 30.334764 | 558.665236 | ||
| Observed: | 24 | 269 | 293 | 8.19 |
| Expected: | 15.090129 | 277.909871 | ||
| Total: | 72 | 1326 | 1398 | 5.15 |
Total Chi² = 7.884843 |Chi| = 2.807996 (2 DF) P = 0.0194
Chi² for linear trend = 7.19275 |Chi| = 2.68193 (1 DF) P = 0.0073
Remaining Chi² (non-linearity) = 0.692093 (1 DF) P = 0.4055
Here the total chi-square test shows a statistically significant association between the classifications, i.e. between tonsil size and Strep. pyogenes carrier status. We have also shown a significant linear trend which enables us to refine our conclusions to a suggestion that the proportion of Strep. pyogenes carriers increases with tonsil size.

 R code
This R code reproduces the example above. It needs no packages and was checked with R 4.6.1. Paste it into R, or save it as a script and run it.
# 2 by k chi-square test with a test for linear trend: the StatsDirect help example
# (Armitage and Berry 1994, palatine tonsil size and carrier status for Strep.
# pyogenes in 1398 children) in R
tonsils <- c("not enlarged", "enlarged", "enlarged greatly")
carriers <- c(19, 29, 24)
non_carriers <- c(497, 560, 269)
counts <- rbind(Carriers = carriers, "Non-carriers" = non_carriers)
colnames(counts) <- tonsils
print(counts)

# R's standard test of independence. chisq.test applies its continuity correction to
# 2 by 2 tables only; it is switched off here because StatsDirect does not use it.
fit <- chisq.test(counts, correct = FALSE)
print(fit)

# The table as the report lays it out: each group's observed counts, total and
# percentage of successes, and the expected frequencies from chisq.test (row total
# times column total divided by the grand total)
six <- function(x) formatC(x, digits = 6, format = "f", drop0trailing = TRUE)
pv <- function(p) {
  if (p < 0.0001) "P < 0.0001" else
    paste("P =", formatC(p, digits = 4, format = "f", drop0trailing = TRUE))
}
pc <- function(x) formatC(100 * x, digits = 2, format = "f", drop0trailing = TRUE)
total <- carriers + non_carriers
k <- length(carriers)
for (i in 1:k) {
  cat("Observed:", carriers[i], non_carriers[i], total[i], pc(carriers[i] / total[i]),
      "\n")
  cat("Expected:", six(fit$expected[1, i]), six(fit$expected[2, i]), "\n")
}
cat("Total:", sum(carriers), sum(non_carriers), sum(total),
    pc(sum(carriers) / sum(total)), "\n")
x2 <- unname(fit$statistic)
cat("Total chi-square =", six(x2), " |Chi| =", six(sqrt(x2)),
    paste0("(", k - 1, " DF) "), pv(fit$p.value), "\n")

# The chi-square for linear trend. prop.trend.test gives the statistic of the formula
# above; its scores are 1 to k unless others are given, as score = c(1, 2, 5) would.
trend <- prop.trend.test(carriers, total, score = 1:k)
print(trend)
x2_lin <- unname(trend$statistic)
# Its square root is a normal deviate; the report prints its absolute value under
# the |Chi| label, so this script does too.
cat("Chi-square for linear trend =", six(x2_lin), " |Chi| =", six(sqrt(x2_lin)),
    "(1 DF) ", pv(trend$p.value), "\n")

# What the trend leaves of the total chi-square tests departure from a linear trend
# on k - 2 degrees of freedom (Armitage and Berry 1994), so it needs k of 3 or more
x2_non <- x2 - x2_lin
cat("Remaining chi-square (non-linearity) =", six(x2_non), paste0("(", k - 2, " DF) "),
    pv(pchisq(x2_non, k - 2, lower.tail = FALSE)), "\n")